
Introducing Graphing and Sorting at Home
Introducing Graphing and Sorting at Home
Why Graphing and Sorting Matter in Early Learning
Before children ever solve equations or read charts, they start learning math through play — by sorting, classifying, and noticing patterns.
When your child groups toy cars by color or counts how many apple slices they have, they’re doing the early groundwork for graphing and data thinking.
Graphing and sorting at home help children:
Strengthen observation and comparison skills
Build logical thinking and organization
Understand quantities and categories visually
And the best part? It all happens naturally through simple, playful moments you can do right in your kitchen, playroom, or backyard.
(Related read: Exploring Numbers Through Daily Routines)


What Are Graphing and Sorting Skills?
Sorting
Sorting means grouping items by shared characteristics — color, size, shape, texture, or type. It teaches kids to notice differences and similarities, which is a foundation for problem-solving.
Graphing
Graphing is taking those sorted groups and showing them visually — like counting how many red, blue, and yellow blocks you have and making a simple bar chart.
This gives children a visual way to see “which has more” or “which has fewer.”
(See also: Teaching Early Math Concepts With Everyday Objects)
Step 1: Start With Hands-On Sorting
Start small and tactile. Kids learn best when they can touch, move, and see what they’re working with.
Try sorting everyday items:
Laundry: Match socks by color or size
Snacks: Sort cereal pieces, fruit, or crackers
Toys: Group blocks, cars, or animals
Nature finds: Sort leaves by shape, rocks by size, or flowers by color
Encourage them to explain their reasoning:
“Why did you put those together?”
“What makes this one different?”
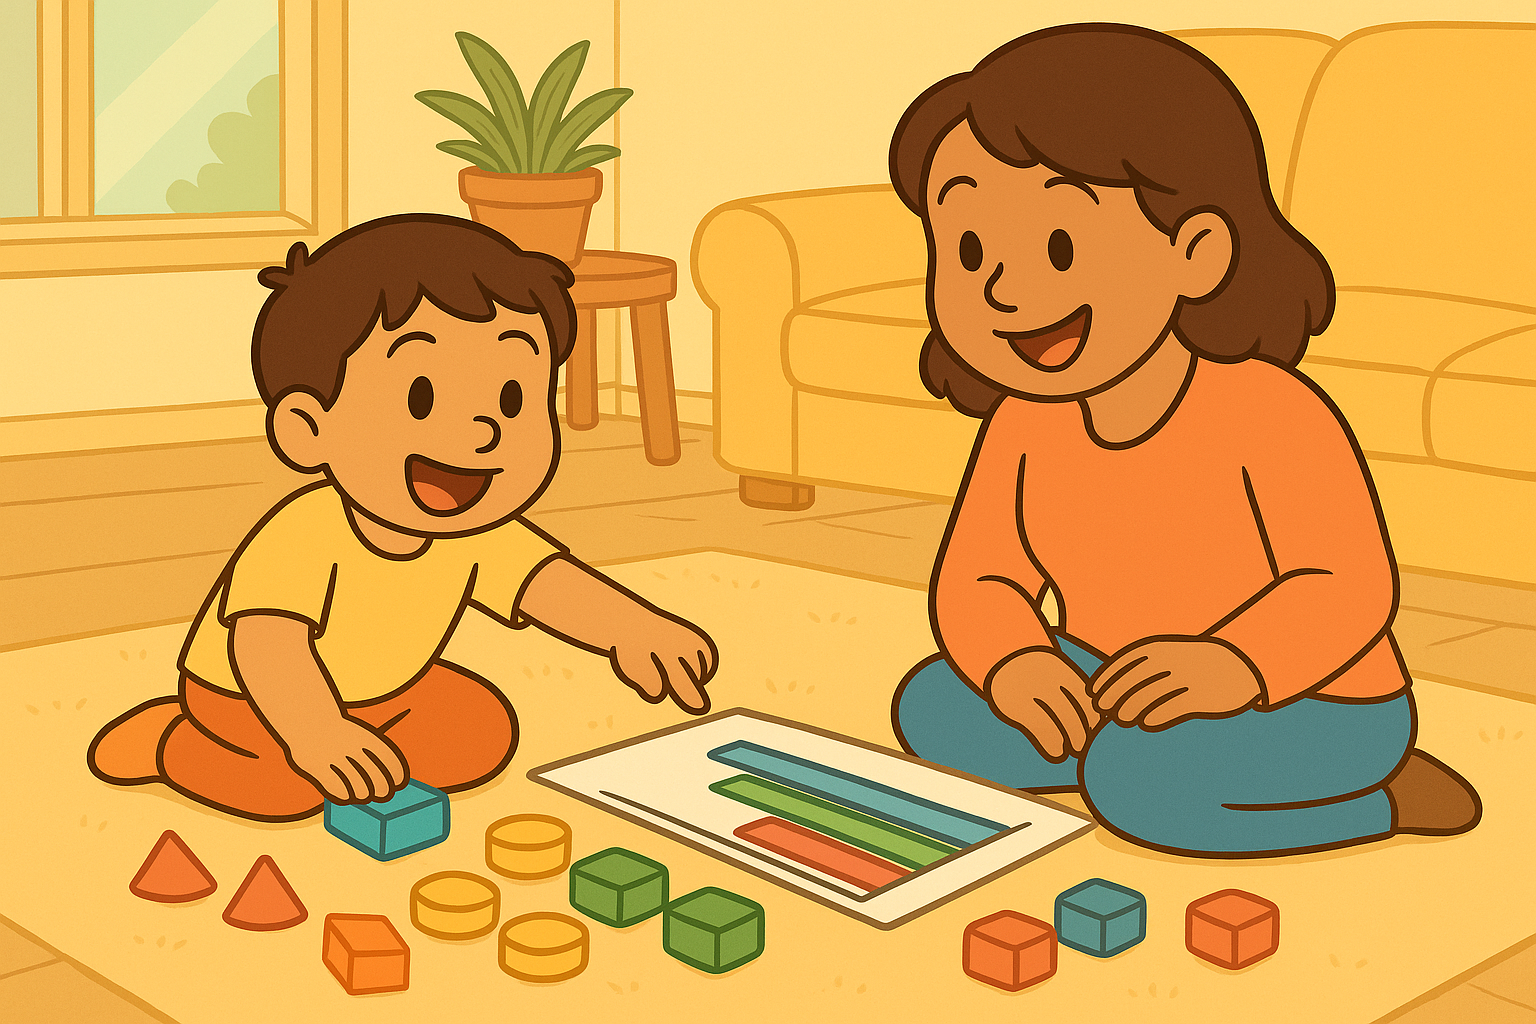
Step 2: Turn Sorting Into Graphing
Once items are sorted, show your child how to organize results visually.
Lay out each group in a line or use a piece of paper as a “graph base.”
Example:
Line up all red blocks in one row, blue blocks in another.
Use stickers or small objects to represent each count.
Count out loud together and compare the lengths of each row.
Then ask simple comparison questions:
“Which color has the most?”
“Which has the fewest?”
You’ve just created your child’s first bar graph!
(Also read: Early Math Through Cooking and Measuring)
Step 3: Add Visual Aids for Connection
Turn your graphs into visual stories.
You can draw circles for favorite snacks, stickers for weather patterns, or even take pictures of real objects to glue onto poster paper.
Visual learning helps kids connect math to the real world — it’s not about numbers on a page, it’s about things they care about.
(See also: How to Use Picture Books to Teach New Concepts)
Step 4: Use Graphing to Talk About Choices and Patterns
Graphing isn’t only about math — it’s about decision-making and communication.
For example:
Snack Graph: “Which snack did we eat most this week?”
Weather Graph: “Was it sunny or cloudy more often?”
Playtime Graph: “Which game did we play most?”
These discussions help children analyze data in everyday life, the earliest form of scientific reasoning.
(Try this too: Using Observation Journals in Early Learning)
Step 5: Make It Playful and Repetitive
The more your child sees sorting and graphing as fun, the faster the learning sticks.
Here are a few Fuzzigram-style favorites:
Toy Parade: Line up stuffed animals from biggest to smallest.
Snack Stack: Count how many of each color candy you have before eating.
Color Hunt: Collect objects around the house to make a “color graph.”
Family Graph: Graph everyone’s favorite fruit or bedtime story.
Repetition helps cement math vocabulary — words like more, less, equal, same, different, most, least.
(Also read: The Power of Puppet Repetition for Memory Retention)
Step 6: Celebrate “Math Talk”
Model curiosity with simple “math talk” phrases throughout the day:
“Let’s see which pile has more!”
“I notice all the square blocks are the same size.”
“Do you think we can sort this another way?”
Talking about what your child sees and thinks turns sorting and graphing into language-rich math learning.
Step 7: Create Family Graphs Together
Turn your child’s new math skills into a family project!
Post a weekly family graph on the fridge:
“How many days were sunny?”
“Which dinner did we like best?”
“What color clothes did we wear the most this week?”
Kids love seeing real-life data — and it helps them understand how numbers tell stories.
(Try this too: Encouraging Independent Learning Through Choice)
The Learning Behind the Play
When children sort, classify, and graph, they’re not just organizing toys — they’re organizing thoughts.
They’re learning to:
Categorize information
Recognize relationships
Draw conclusions from what they observe
These are the same reasoning skills used in science, writing, and critical thinking later on.
And when you make it fun, they learn without even realizing it.
Fuzzigram’s Favorite Sorting & Graphing Ideas
Sort laundry by color or size
Graph snack choices with stickers
Compare weather or favorite foods over a week
Count and line up toy types or colors
Create “family favorite” charts together
This content is for educational purposes and is not a substitute for professional medical or psychological advice.